Arrowheads Vs. Cave Paintings

Cave of Hands (13000 - 9000 BCE), Argentina.

Why Human Data Is More Powerful than Tools or Platforms.

At KL we realize the value of data is far greater than either analytic tools or platforms.  As a team, we spend a lot of our time discussing the topics of data and analytics, especially analytics tools. We used to devote more time to this latter topic in terms of selection of existing tools and development of new ones. We spent less time talking about platforms and data.  Overt time we have come to understand that all three of Data, Platform, Analytics are vital ingredients to what we do.  This is visualized in our logo, we are about the triangulation of all three.

On this journey, I have come to realize that some things take a long time to learn. In my case , when you study engineering, you realize that the desire to make tools (in the broadest sense) is in your DNA. Not just your own, in everyone's.

Building tools is what humans do, whether it's a flint arrowhead, the first machine screw or a self-driving car. It's what we have been doing for millennia and what we will continue to do.

As a species I think we are blind to tools because they are so abundant and seemingly easy to produce - because as a species we make so many of them.  In that sense they are not very interesting and those that are interesting are soon copied and made ubiquitous.

What is true of axes, arrowheads and pottery is also true of analytics businesses. The reason it is hard-to-build a tool-based business is that the competition is intense. As a species, this won't stop us trying.

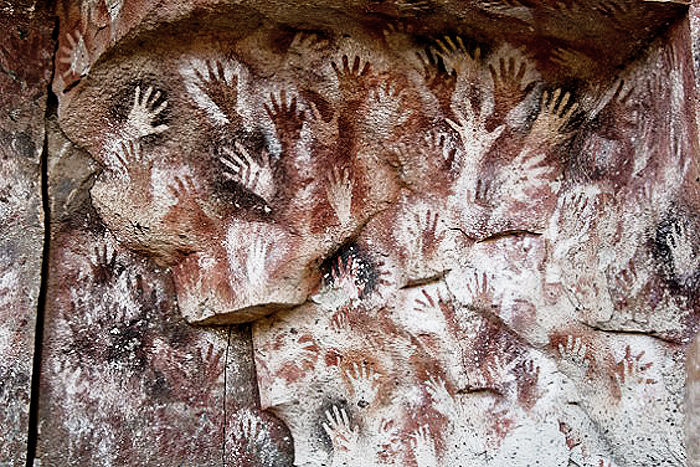
In stark contrast to analytics tools, is the importance of data and platforms. If a flint arrowhead is a tool then the cave painting is data. When I look at images of cave paintings, such as the cave of hands shown, I am in awe.  A cave painting represents a data point of human history, the cave wall the platform that allows us to view it.

This is very relevant to building a data-driven business, those firms that have access to data and provide a platform to engage with it will always find more traction than those that build tools to work on top of platforms and data.

Human data points are hard to substitute and, as a result, are more interesting and have a greater commercial value than tools.

There is no free lunch in AI

In conversations with a friend from university I learned about the No Free Lunch Theorem and how it affects the state-of-the-art of machine learning and artificial intelligence development.

Put simply, the No Free Lunch Theorem (NFL) proves that if an algorithm is good at solving a specific type of problem then it pays for this success by being less successful at solving other classes of problems.

In this regard, Algorithms, AI Loops and Machine Learning solutions are like people; training to achieve mastery in one discipline doesn't guarantee that same  person is a master in a related discipline without further training. However, unlike people, algorithm training might be a zero-sum game with further training likely to reduce the competency of a machine learning solution in an adjacent discipline. For example, while Google's AlphaZero can be trained to beat world champions at chess and Go,  this was achieved using separate instances of the technology. A new rule set was created to win at chess rather than adapting the Go rule set. Knowing how to win at Go doesn't guarantee being able to win at chess without retraining.

What does this mean for the development of AI? In my opinion while there are firms with early-mover advantage in the field, their viable AI solutions are in very deep domains that tend to be closed systems, e.g. board games, video games, and making calendar appointments. As the technology is developed, each new domain will require new effort, likely to lead to a high number of AI solutions/providers. So rather than an AI future dominated by corporate superpowers there will be many providers, each with a domain-distinct AI offerings.


Conagra Vs Pinnacle Foods

Reproduced Courtesy of Market Watch.

We dug in to this story using our grocery data sets. By tracking promotional sales up to, and after, the announcement we saw a 2% year-on-year decline in average price paid for Pinnacle Foods' products. Following Conagra's announcement, there was an immediate price hike that took average prices  6% higher in the following six months.  As per this article, our findings suggest a lack of due diligence was performed during the transaction.

To see our full report, send an email to support@knowledgeleaps.com.

M&A Data Base & API, Complete!

We have just released version 1.2 of our UPC  to ISIN / Stock Ticker mapping API and data base.

The data set covers 1,500 brands in 424 categories spanning 50,000 individual products.  We have also made our data  point-in-time accurate, going back 10 years.  Submitting a UPC and a date to the API and it will return the ISIN number of the company that owns product at that point in time - provided the company was public. For private companies the API can return customizable values.

In time, we will provide access to the underlying data so that firms can analyze the characteristics of firms that are acquiring packaged-goods brands as well as those brands that get disposed of.

A Programming Language For Data Engineering

Noodling on the internet I read this paper (Integrating UNIX Shell In A Web Browser). While it is written 18 years ago, it comes to a conclusion that is hard to argue with: Graphical User Interfaces slow work processes.

The authors claim that GUI slow us down because they require a human to interact with them. In building a GUI-led data analytics application I am inclined to agree — the time and cost associated with development of GUIs increases with simplification.

To that end we are creating a programming language for data engineering on our platform.  Our working title for the language is wrangle (WRANgling Data Language). It will support ~20 data engineering functions (e.g., filter, mapping, transforming) and the ability to string commands together to perform more complex data engineering.

Excerpt from paper: "The transition from command-line interfaces to graphical interfaces carries with it a significant cost. In the Unix shell, for example, programs accept plain text as input and generate plain text as output. This makes it easy to write scripts that automate user interaction. An expert Unix user can create sophisticated programs on the spur of the moment, by hooking together simpler programs with pipelines and command substitution. For example:

kill `ps ax | grep xterm | awk '{print $1;}'`

This command uses ps to list information about running processes, grep to find just the xterm processes, awk to select just the process identifiers, and finally kill to kill those processes.

These capabilities are lost in the transition to a graphical user interface (GUI). GUI programs accept mouse clicks and keystrokes as input and generate raster graphics as output. Automating graphical interfaces is hard, unfortunately, because mouse clicks and pixels are too low-level for effective automation and interprocess communication."

Spam, Bots, and Turing Tests

Since I started my blog I have had 350+ spam comments. They tend to come in waves of similar types of comments. One week they might all be in Russian, the next week they all refer to Houdini and seatbelts. Broadly speaking they fall in to two categories, they are either flattering and wanting me to click on a malicious link or they make no sense whatsoever.

This latter class of comments are interesting because of their seeming pointlessness - there is no link for me to click on contained in the comment.  This got me thinking that when I set the comments to "spam", "trash" or "publish" the author of those comments would get a message back saying: " Your comment has been published/deleted". This could be useful feedback if these comments were generated by a computer and some one was trying to write a bot that could perform natural language processing and maybe even pass the Turing Test. To train the bot you would need lots of examples of text that can be easily parsed from a web page, and where better than a blog to get that sort of information. Each time I set the status of a comment to spam I am helping train a bot and  have become an unwitting servant of a malicious hackers.


Big Data, Laws of Physics and Sampling

One of the issues with large data files, is that very quickly you come up against the physical laws of the universe; hash function collision rates have meaningful impact on how exhaustive your calculations are and unbounded memory structures create significant performance issues.

With our KL app, we are building  technology to get round that.  As our Maximum Viable File Size has grown from thousands of rows, to millions of rows and now to billions of rows we realized that the laws of physics are a real nuisance when analyzing data.

To that end, we have rolled out a data sampling feature that allows users to run analysis on a randomized subset of a data file.  When speed of analysis is important then this feature allows users to get round the laws of physics and produce representative results.

Redesign Rationale and New Features


Knowledge Leaps Landing Page Image

The objective behind the redesign is to make better use of screen real estate, to ease navigation and simplify work flows. Since we began development, the product has become more complex, by necessity. Making it simple and easy to use is central to the brief.

The rolling brief of "simplify" will continue to be used as the capabilities of the platform become more advanced.  The UI will continue to evolve as more features are launched. In this release we have added the following features:

Data formats - users can now import zipped files, comma- , semicolon-, and pipe-delimited data files structures. For parsing we now have automatic detection of delimiters.

Column Reduction - users can use this feature to delete fields in the data and save a new, reduced, version of the data. This is a useful feature for stripping out PII fields or fields that contain "bloat".  Improving performance and enhancing security.

Data Extraction - users can extract unique lists of values from fields in a data set. The primary use case for this feature is to allow users to create audiences based on behaviors. These audiences can then be appended to new data sets to identify cross-over behavior.

Data Sampling - users can randomly sample rows from a data file. For very large data sets, performing exhaustive calculations is time and resource intensive. Sampling a data set and analyzing a subset is based on sound statistical principles and rapidly increases productivity for large data sets.

Transform Filters - users can transform a filter in to a mapping file. Data reduction is an important step in data analysis, converting filters into data reduction maps will make this effortless.

Dynamic Mapping - users can access API end points, pass values to the end point and take the returned value as the "mapped value". Initially this will be limited to an internal api that maps product code to brand and owner. New API connections will be added over time.

Multiple AWS Accounts - users can now specify multiple AWS account access keys to connect to. This is to incorporate the launch of KL data products. KL now offers a range data products that firms can subscribe to. Multiple AWS account capabilities allows for customers to bring many different data streams into the account environment on the platform.

As well as building solutions that can be accessed through a simple form/button led UI, these features are the building-blocks of future analytics solutions. These features are be platform-wide universal tools, untethered from a specific context or environment. This will give our product development team greater flexibility to design and implement new functions and features.

Patented Technology

The patent that has just been awarded to Knowledge Leaps is for our continuous learning technology.  Whether it is survey data, purchase data or website traffic / usage data., the technology we have developed will automatically search these complex data spaces. The data spaces covers the price-demand space for packaged goods, or the attitudinal space of market research surveys and other data where there could be complex interactions.  In each case, as more data is gathered - more people shopping, more people completing a survey, more people using an app or website - the application updates its predictions and builds a better understanding of the space.

In the use-case for the price-demand for packaged goods, the updated predictions then alter the recommendations about price changes that are made. This feedback loop allows the application to update its beliefs about how shoppers are reacting to prices and make improved recommendations based on this knowledge.

In the survey data use-case, the technology will create an alert when the data set becomes self-predicting. At this point capturing further data is unnecessary to understand the data set and carries an additional expense.

The majority of statistical tools enable analysts to identify the relationships in data. In the hands of a human, this is a brute-force approach and is prone to human biases and time-constraints. The Knowledge Leaps technology allows for more systematic and parallelized approach - avoiding human bias and reducing human effort.