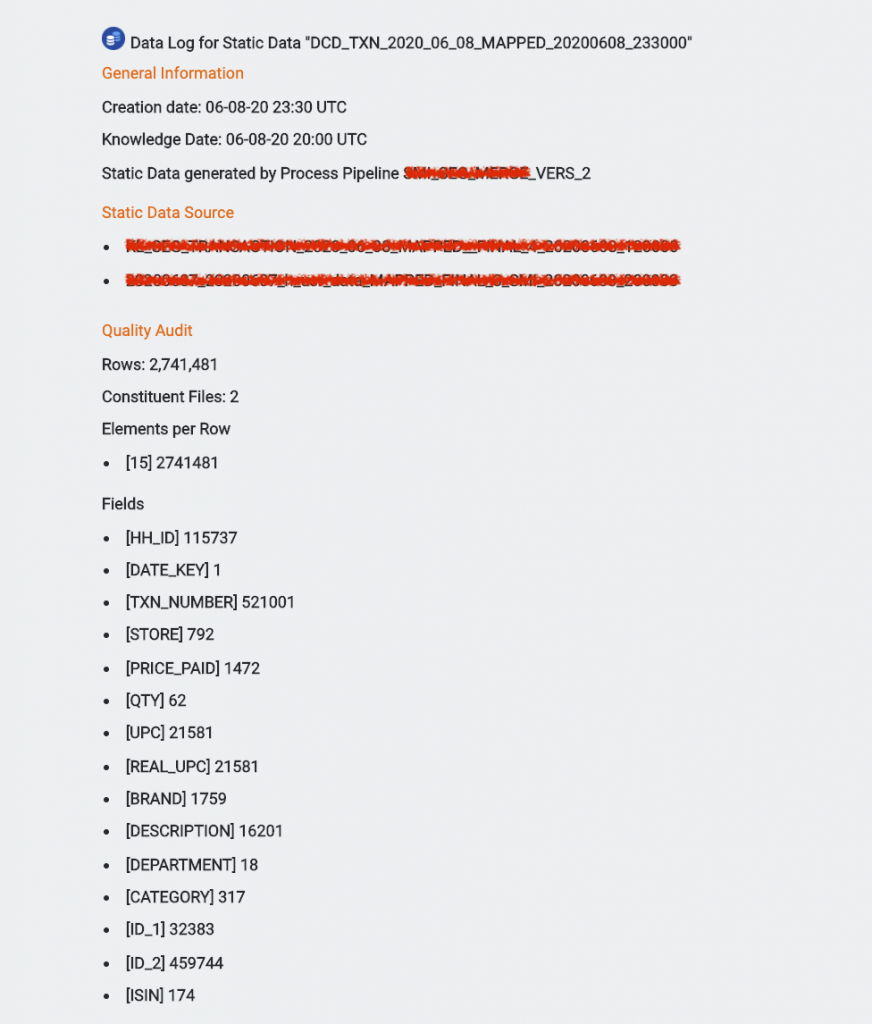
Today, we released a new set of features. The primary feature is a new auditing tool that helps data engineers quickly profile a data set in terms of column cardinality, row count and the constituent file count. This simple feature gives a quick snapshot of a dataset and identifies any potential data issues. In a production pipeline this prevents corrupted data being dispatched.
Data Audit Icon
Clicking the icon performs the audit. Once completed all information is viewed in the information page for each data set.
When you are building data products and filtering data files, it is important to keep track of what you have combined to make a new data set and what you have removed. This feature has saved us countless hours.
From an audit perspective we can build a complete history of a dataset - when it was added to the platform, how it was processed and when/who/where it was delivered / downloaded. This takes a removes a time-draining communication burden from our teams.
We can also add commentary and narratives to a data set. This helps us build transparency and persistent-state knowledge about data.
Today we rolled out our new charting feature. This release marks an important milestone in the development of Knowledge Leaps (KL).
Our vision for the platform has always been to build a data analysis application platform that lets a firm harness the power of distributed computing and a distributed workforce.
Charts and data get siloed in organisations because they are buried in containers. Most charts are contained on a slide in a PowerPoint presentation that sits in a folder on a server somewhere in your company's data center.
We have turned this on its head in our latest release. Charts that are produced in KL remain open and accessible to all users. We have also built in a collaborative interpretation feature where a group of people spread across locations can interpret data as part of a team rather than alone. This shares the burden of work and build more resilient insights since people with different perspectives can build the best-in-class narrative.
We rolled out our No Code Database feature today. Just plug in a data feed and add data to a customizable database with zero lines of code, and zero knowledge of the inner workings of databases. All this in under a minute.
Setting up a database in the cloud is confusing and complex for most people. Our technology puts the power of cloud-based databases at everyone's finger tips. No need for the IT team's intervention. No need to learn remote login protocols. No need to learn any code.
We have also added in some useful aggregation and summarization tools that let you extract data from databases straight into reports and charts. Again, no code required.
We are adding to our no-code data engineering use cases. Our new CollectionManager feature plugs data pipelines into databases with no code just using a simple drag-and-drop interface.
This feature allows users with zero knowledge of databases and query languages to import data into a database. An additional UI will then allow them to create queries, aggregations and extracts using a simple UI.
The UI can be set up to update the database with new data as it is arrives from external sources, it will also automate extract creation as new data is added.
Example use-cases for this feature would be in the creation of data feeds for dashboards that auto-populate, or creating custom data products which can be timed with a guaranteed delayed delivery time. This feature will also drive our retail experimentation business - we can design and set up a data framework that captures and tags the results from test-and-learn activity.
There will always be a plentiful supply of data scientists on-hand to perform hand-cut custom data science. For what most businesses requirements, the typical data scientist is over-skilled. Only other data scientists can understand their work and, importantly, only other data scientists can check their work.
What businesses require for most tasks are people with the data-engineering skills of data scientists and not necessarily their statistical skills or their understanding of a scientific-method of analysis.
Data engineering on a big scale is fraught with challenges. While Excel and Google Sheets can handle relatively large (~1mn row) datasets there is not really a similar software solution that allows easy visualization and manipulation of larger data sets. NoSQL / SQL-databases are required for super-scale data engineering, but this requires skills of the super-user. As 'data-is-the-new-oil' mantra makes its way into businesses, people will become exposed to a growing number datasets that are beyond the realm of the software available to them and, potentially, their skill sets.
At Knowledge Leaps we are building a platform solution for this future audience and these future use-cases.The core of the platform are two important features: Visual Data Engineering pipelines and Code-Free Data Science.
The applications of these features are endless; from building a customer data lake, or building a custom-data-pipeline for report generation or even creating simple-to-evaluate predictive models.
We are expanding the operational functions that can be applied to data sets on the platform. This week we pushed out another product release incorporating some new functions that are helping us standardize data streams. Over the next few weeks we will continue to broaden out the data engineering capabilities of the platform. Below is a description of what each function does to data files.
We have also completed Exavault and AWS S3 integrations - we can know upload to as well as download from these two cloud providers.
As we work with more closely with our partner company DecaData, we are building tools and features that help bring data products to market and then deliver them to customers. A lot of this is repetitive process work, making it ideal for automation. Furthermore, if data is the new oil, we need an oil-rig, refinery and pipeline to manage this new commodity.
Our new feature implements these operations. Users can now create automated, time-triggered pipelines that import new data files and then perform a set of customizable operations before delivering them to customers via SFTP or to an AWS S3 bucket.
Why Human Data Is More Powerful than Tools or Platforms.
At KL we realize the value of data is far greater than either analytic tools or platforms. As a team, we spend a lot of our time discussing the topics of data and analytics, especially analytics tools. We used to devote more time to this latter topic in terms of selection of existing tools and development of new ones. We spent less time talking about platforms and data. Overt time we have come to understand that all three of Data, Platform, Analytics are vital ingredients to what we do. This is visualized in our logo, we are about the triangulation of all three.
On this journey, I have come to realize that some things take a long time to learn. In my case , when you study engineering, you realize that the desire to make tools (in the broadest sense) is in your DNA. Not just your own, in everyone's.
Building tools is what humans do, whether it's a flint arrowhead, the first machine screw or a self-driving car. It's what we have been doing for millennia and what we will continue to do.
As a species I think we are blind to tools because they are so abundant and seemingly easy to produce - because as a species we make so many of them. In that sense they are not very interesting and those that are interesting are soon copied and made ubiquitous.
What is true of axes, arrowheads and pottery is also true of analytics businesses. The reason it is hard-to-build a tool-based business is that the competition is intense. As a species, this won't stop us trying.
In stark contrast to analytics tools, is the importance of data and platforms. If a flint arrowhead is a tool then the cave painting is data. When I look at images of cave paintings, such as the cave of hands shown, I am in awe. A cave painting represents a data point of human history, the cave wall the platform that allows us to view it.
This is very relevant to building a data-driven business, those firms that have access to data and provide a platform to engage with it will always find more traction than those that build tools to work on top of platforms and data.
Human data points are hard to substitute and, as a result, are more interesting and have a greater commercial value than tools.
Noodling on the internet I read this paper (Integrating UNIX Shell In A Web Browser). While it is written 18 years ago, it comes to a conclusion that is hard to argue with: Graphical User Interfaces slow work processes.
The authors claim that GUI slow us down because they require a human to interact with them. In building a GUI-led data analytics application I am inclined to agree — the time and cost associated with development of GUIs increases with simplification.
To that end we are creating a programming language for data engineering on our platform. Our working title for the language is wrangle (WRANgling Data Language). It will support ~20 data engineering functions (e.g., filter, mapping, transforming) and the ability to string commands together to perform more complex data engineering.
Excerpt from paper: "The transition from command-line interfaces to graphical interfaces carries with it a significant cost. In the Unix shell, for example, programs accept plain text as input and generate plain text as output. This makes it easy to write scripts that automate user interaction. An expert Unix user can create sophisticated programs on the spur of the moment, by hooking together simpler programs with pipelines and command substitution. For example:
kill `ps ax | grep xterm | awk '{print $1;}'`
This command uses ps to list information about running processes, grep to find just the xterm processes, awk to select just the process identifiers, and finally kill to kill those processes.
These capabilities are lost in the transition to a graphical user interface (GUI). GUI programs accept mouse clicks and keystrokes as input and generate raster graphics as output. Automating graphical interfaces is hard, unfortunately, because mouse clicks and pixels are too low-level for effective automation and interprocess communication."