Bookmarking And Workflows

If your job involves working with lots of different data files and you work in a team that uses these different data sets, finding the latest version can be a time suck. We have an answer for that with two new features we have launched this week.
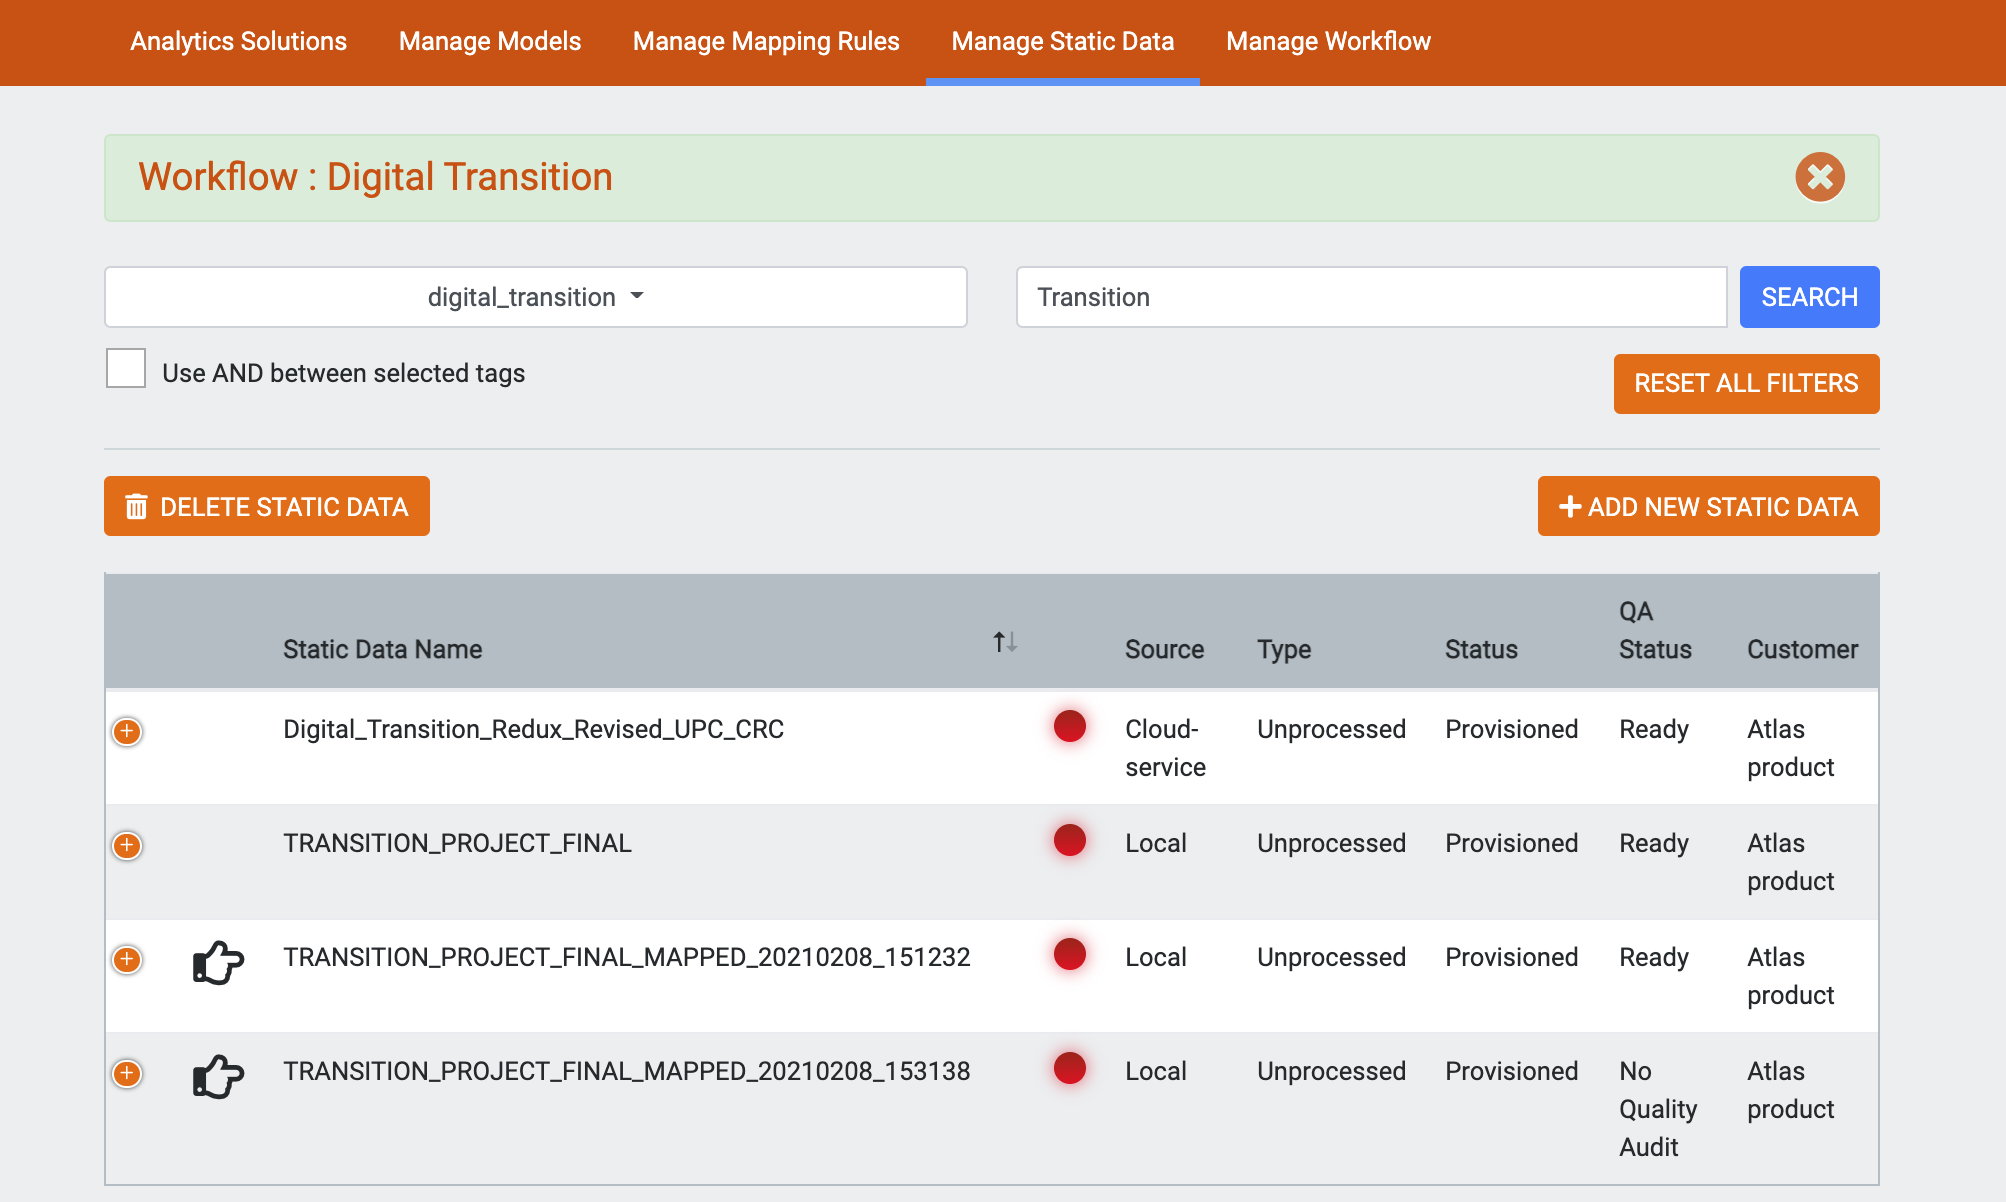
Workflows

The workflows feature lets you view only data sets,reports, charts and operation files that have specific tags assigned. Once a workflow is selected these tags persist through all views in the app.
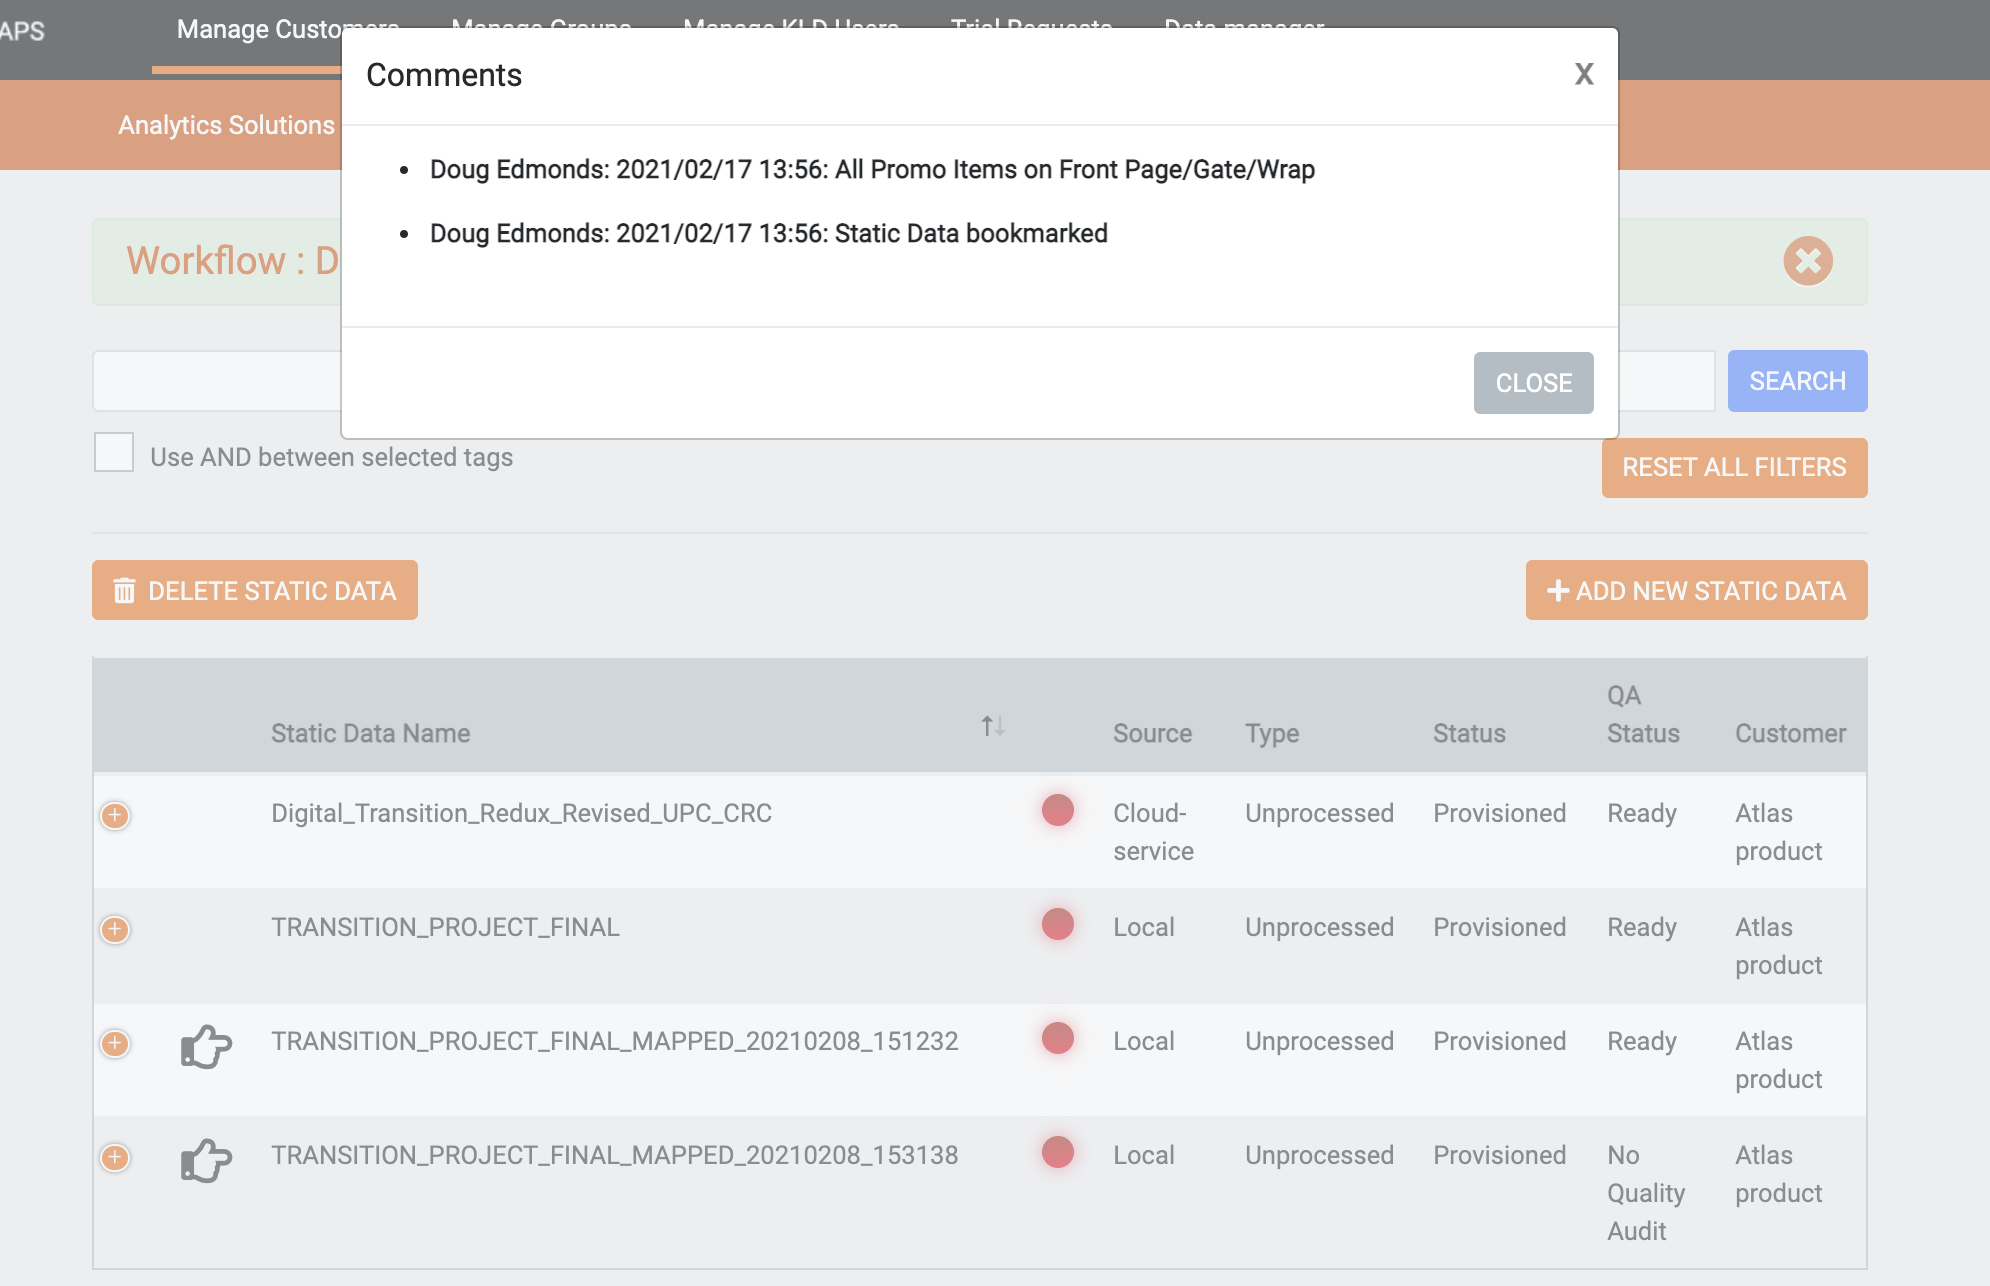
Bookmarks

This feature bookmarks a specific chart or dataset so that it can be easily found and distinguished from other files and charts in the view. When you have created the perfect chart, bookmark it!

We Eat Our Own Dog Food

I had heard about the phrase "do the dogs eat the dog food" from a start-up podcast I had listened. The idea being if your firm is building a product for customers, does your firm also use it.

I then read this adaption of the phrase and thought it applies to us. We ship features and code that help our customers and that help us do our jobs better. We make "dog food" and we eat it. So, if the UI for a new feature is clunky or an implementation doesn't quite hit the mark, we know about because our team will tell us.

Feature Release: July 13

Today, we released a new set of features. The primary feature is a new auditing tool that helps data engineers quickly profile a data set in terms of column cardinality, row count and the constituent file count. This simple feature gives a quick snapshot of a dataset and identifies any potential data issues. In a production pipeline this prevents corrupted data being dispatched.

Data Audit Icon

Clicking the icon performs the audit. Once completed all information is viewed in the information page for each data set.

Forecasting Using Prior Distributions

We have been building some product forecasting models using Monte Carlo methods. Sales distributions are often skewed right. Using normal approximations tends to over inflate forecast estimates, since the distribution is not centered around the mean. Further more the standard deviation of skewed distributions tends to produce estimates with very wide variances - by definition.

To overcome this, we use a Monte Carlo simulator - that draws from the sales distribution at random. Creating a sample of many estimates not only gives a more accurate estimate, it is also helps us calculate more realistic margins of error.

Feature Release: July 3rd

New features rolled out this week:

  • Apply filters and mapping files to other filters and mapping files. This feature helps create randomized lists and sub filters based on new criteria. For example, extract a list of userIDs from a data file, apply gender from a look up table. Then filter this list by gender to create a specific list of users. This new file can then be sampled randomly to create a new list of random userIDs that meet a specific criteria.

Feature Release June 21

List of features/fixes in latest app release:

  • Download file compression by default. When users download data to their local computers they are compressed by default.
  • Merge data now runs in background: some users were struggling trying to combine multi-GB data files. We now merge large data sets in the background to avoid memory issues.
  • Server-less charting: All charting has been pushed to server-less environment.

New Feature: Parallelized Chart Production at Scale

We launched a new feature today. The Knowledge Leaps platform allows users to specify hundreds of charts with a few clicks. For example a user can plot sales by date split by store ID using a simple flow. This can lead to 1000s of charts being produced, each one derived from millions of lines of data.

Data Knowledge Graph

When you are building data products and filtering data files, it is important to keep track of what you have combined to make a new data set and what you have removed. This feature has saved us countless hours.

From an audit perspective we can build a complete history of a dataset - when it was added to the platform, how it was processed and when/who/where it was delivered / downloaded. This takes a removes a time-draining communication burden from our teams.

We can also add commentary and narratives to a data set. This helps us build transparency and persistent-state knowledge about data.

AI: A Working Assumption

Building a system that is 100% autonomous and makes its own decisions is both hard and high risk. Given that Amazon, with all its resources and smarts, uses human input for the low/no consequence AI built into Alexa, it is fairly safe to assume that *all* other firms making AI claims have a human involved in at least one critical step.