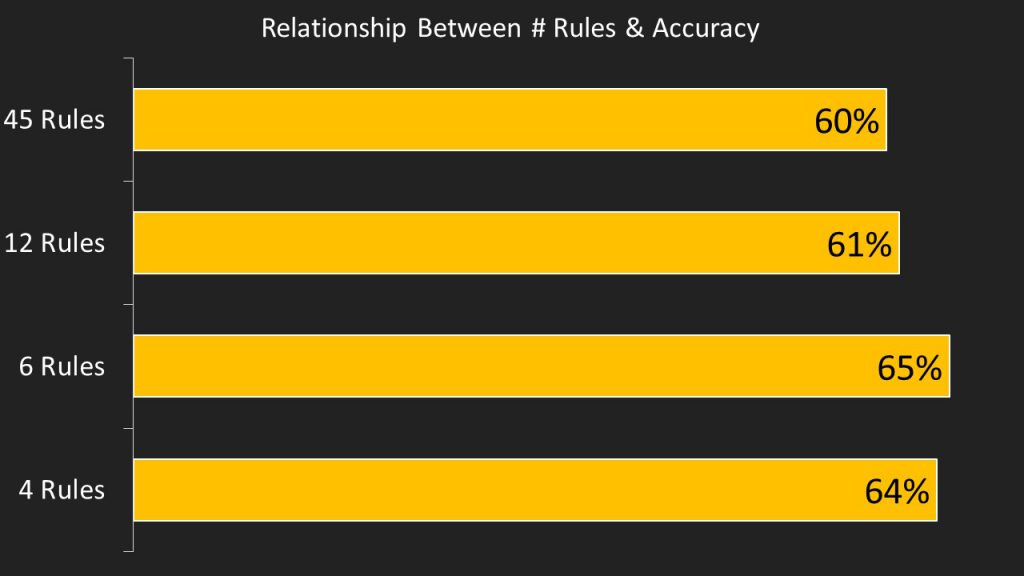
We have been running trials on a 16 question survey, predicting the responses to a particular question using other data in the survey. What we discovered is that the more rules we allowed KL analytics engine to produce, the lower the accuracy and the harder it becomes to explain the model to another person.
Predictive Accuracy of Knowledge Leaps Analytics Engine Using 10-Fold Validation - Best Guess Accuracy = 50.2%
To test the functionality of the application we have been using some real life data either from people we know who work with data in various companies or from Kaggle (the data science community recently acquired by Google).
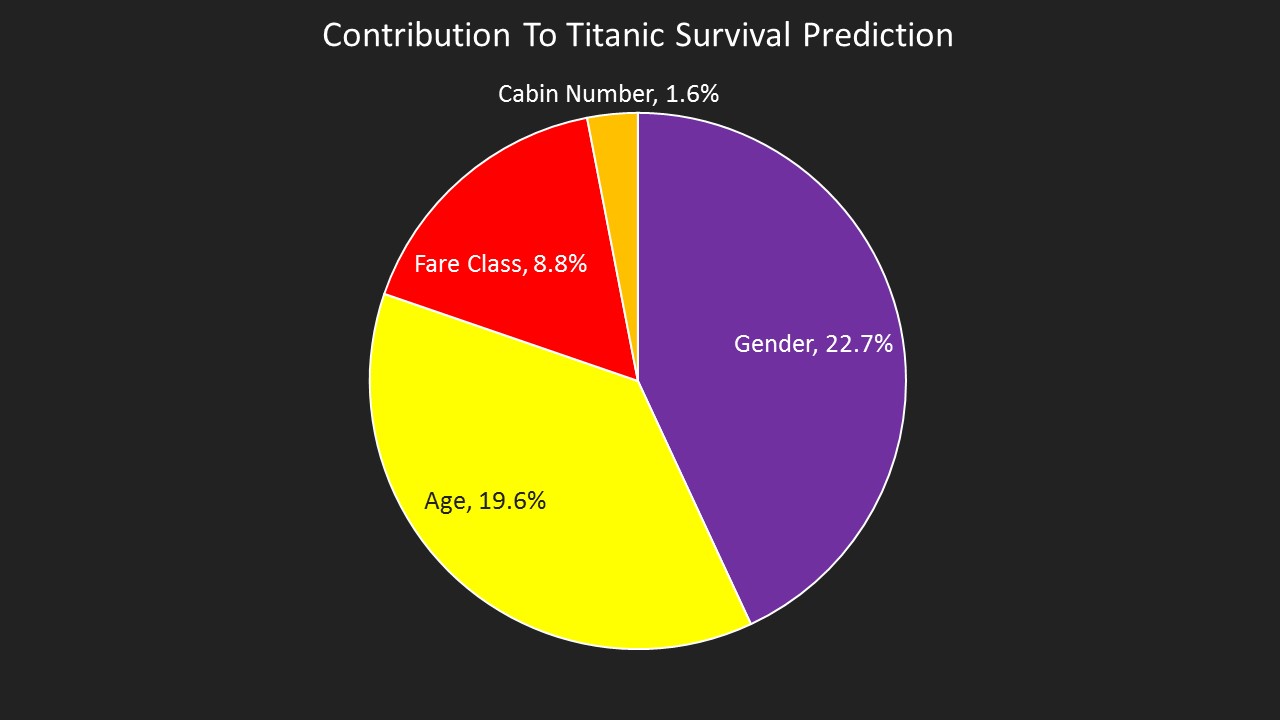
Our favorite test data set from Kaggle is the Titanic survivor data. We like it because there are a small number of records in it (c. 900) and it does not contain many variables (the notable ones are gender, age, point of embarkation, cabin number, cabin level and whether they survived or not).
Kaggle runs competitions to see which data scientist can produce the most accurate prediction of survival. While we are interested in accuracy (the model produced on KL has an accuracy of 80% vs a guessing accuracy of 51% based on the incidence of survivors in the data we have), we are more interested in both accuracy and human readability of the model. This graph shows the outputs of the model drivers, this shows, for example, that a passenger's gender contributes 22.7% of our knowledge about whether they survived or not.
While accuracy is important, being able to relate the model to other people is just as important as it means that we humans can learn, not just machines.
Contribution of Factors On Survival Outcome of Titanic Passengers
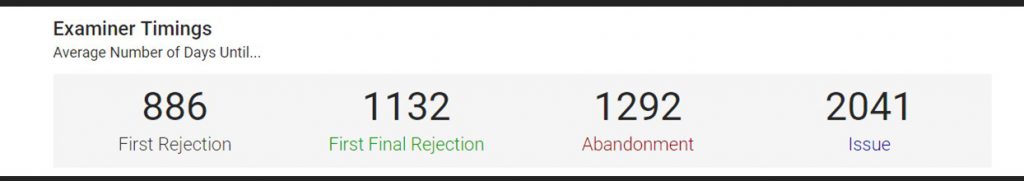
My patent attorney sent me through some interesting data about the USPTO patent agent reviewing my application. The agent takes an average of 886 days to first respond to an application and if we follow the average path then we will expect to receive our patent approval on August 3, 2020, a mere 2041 days after filing it.
When we excitedly tell people that the new version of Knowledge Leaps incorporates k-fold validation, their eyes glaze over. When we tell people about the benefits of this feature, we usually get the opposite response.
In simple terms, k-fold validation is like having a team of 10 pHDs working on your data, independently and simultaneously. The application doesn't produce just one prediction, it makes 10 which are all independent of one another. This approach outputs more general models, these are closer to a rule of thumb and are consequently useful in more contexts. Another step toward human-centered analytics without the human bias.
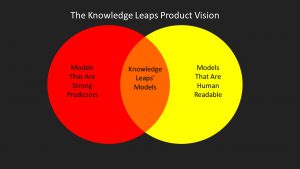
A recurring theme of this blog will be the differences between human readable models vs highly predictive models, my vision for the product is to combine these two elements - producing accurate models that can be easily explained to non-technical people. Putting the human into analytics, if you will. The challenge will be how to turn this into a reality without confusing the user.
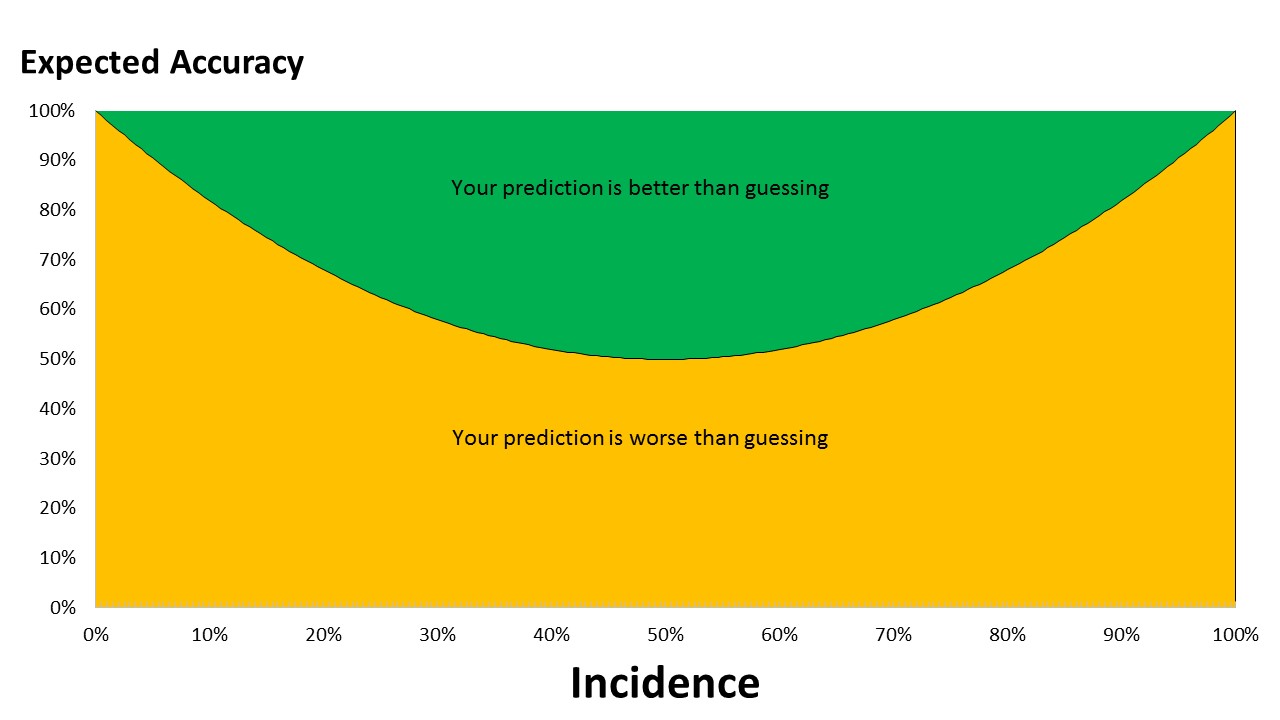
When it comes to designing and implementing algorithms for Knowledge Leaps I have spent a lot of time thinking about accuracy in relation to making predictions. I soon realized that there is a mathematical relationship between the accuracy of a guess and the incidence of what you are trying to predict.
For instance, if you have built a model for predicting whether or not a roulette ball will fall into the zero slot on a roulette wheel with 37 numbers (0-36) then your model has to be correct (at predicting success or failure) at least 94.67% of the time. However, if you want to predict red or black then your model needs to be correct 50.04% of the time to be better than a pure guess.
The graph below shows the relationship as a function of incidence (the rate of what we are trying to predict).
Broad conclusions we can draw from this relationship:
When we are trying to predict outcomes which have an incidence of between 20% and 80%, there is a lot of potential for producing a worthwhile model that can improve on a guess.
When the incidence of outcomes is less than 5% and greater than 95%, models need to be delivering 91%+ accuracy to be of any help. This is the realm of medical diagnosis, an area where guesswork isn't welcome.
Since 66% of the chart is territory where a guess is better than a model, if we produced random models to make a prediction, 66% of the time a guess would be better. Obviously, if we aggregate up the results of lots of random guesses we can produce more accurate predictions (e.g. Random Forests). However we then run into the issue of not creating human readable models.