Human Analysts Guarantee Bias

During an interview between Shane Parrish and Daniel Kahneman, one of the many interesting comments made was around how to make better decisions. Kahneman said that despite studying decision-making for many years, he was still prone to his own biases. Knowing about your biases doesn't make them any easier to overcome.

His recommendation to avoid bias in your decision making is to devolve as many decisions as you can to an algorithm. Translating what he is saying to analytical and statistical jobs suggests that no matter how hard we try, we always approach analysis with biases that are hard to overcome. Sometimes our own personal biases are exaggerated by external incentive models. Whether you are evaluating your bosses latest pet idea, or writing a research report for a paying client, delivering the wrong message can be costly, even if it is the right thing to do.

Knowledge Leaps has an answer. We have built two useful tools to overcome human bias in analysis. The first is a narrative builder that can be applied to any dataset to identify the objective narrative captured in the data. Our toolkit can surface a narrative without introducing human biases.

The second tool we built removes bias by using many pairs of eyes to analyze data and average out any potential analytical bias. Instead of a single human (i.e. bias prone analyst) looking at a data set our tool lets lots of people look at it simultaneously and share their individual interpretation of the data. Across many analysts, this tool will remove bias through collaboration and transparency.

Get in touch to learn more. doug@knowledgeleaps.com.

The Power of Non-Linear Analysis

A lot of what an analyst does is perform linear analysis. These analyses are guaranteed to produce human-readable stories, even if they aren't  insightful.

The world in which we live is not linear.  In the book, 17 Equations That Changed The World, the author, Ian Stewart,  selects only three equations that are linear, the rest are non-linear.

This shows the limitations of linear analysis in explaining the world around us. A lot of what we experience in life is non-linear, from the flight of a ball in the air (parabolic) to the growth of your savings (exponential).

What's true of the physical world is also true of the human brain too.  One example is the way in which our brains use non-linear relationships to evaluate choices. One of the foundational tenets in the field of Behavioral Economics is Kahneman and Tversky's Prospect Theory and Loss Aversion.

Loss aversion describes the non-linear relationship between the value associated with gain of an item versus the value associated with loss of the same item.  We would rather not lose something than find that same thing.

Whether we are conscious of this or not, our brains use it every day when we evaluate choices, protecting what we own is a greater driver of behavior than gaining new things,  it is one reason why the insurance market is so large.

A good analyst will over lay this non-linear understanding of the world when interpreting findings, however it would be useful if analytics software could allow for human-readable non-linear analytics (it's what makes Support Vector Machines so powerful, yet so indecipherable).

New Feature: Handling Event-Type Data

I have spent a lot of time thinking about data and data structures. What I have learnt is that there are two types of data structures; data which has only one row per user (e.g survey data) and data which has one row for each unique user event (i.e. click stream data from an app or website) and multiple rows for any user.

Many web-based analytics platforms, like Amazon's own ML platform, only let its users upload data that has a simple data structure (one row per user such as survey data and customer profile data). Very few platforms allow users to upload event-type data and engineer it into a simple form that can be used in predictive analytics.

Transforming event data requires data engineering and this process can be daunting. To develop Knowledge Leaps further, we have spent a lot of time looking at a wide range of event-type data use cases. Our aim has to been to create a systematic, easy-to-use (given the task) approach to simplifying the data engineering work flow. As with our models, we also want our user interface and processes to be human-readable too.

In our latest release we are launching the Data Processor module. The design of this module has drawn heavily on working with real-world event data.  This new feature allows the platform to take in any data type and perform simple processing rules to create analytics-ready data sets in minutes.

Should Linear Analysis Be The Only Tool We Use

99% of analysis carried out by analysts involves a cross tab - analyzing one piece of data through the lens of another.

The cross tab is the de facto standard tool and while it has limitations from an analytical perspective, the cross tab is produces human readable outputs. The challenge lies in the fact that the cross tab produces linear results but not definitive results. They tell a story but often not a satisfactory one. For instance, if we look at how people voted in the 2016 Presidential Election in the USA using this data we can see a weak story appear. While many commentators wanted to label Trump supporters as white, poor and uneducated, these labels are only partially true. They are not definitive.  Were we to use just these simple descriptors to predict who voted for Trump (or Clinton) and provide a definitive story then the story would be much more convoluted to relay, since it would rely on non-linear transformation of these descriptors.

The challenge for analytics is to find the right blend of Linear Analytics and Non-Linear Analytics that combines predictive power and retains human-readability.

In AI, We Trust.

I think this article sums up the challenges of facing the data science community and, by extension, all data analysts. While much of what we are doing isn't in the realms of AI, a lot of the algorithms that are being used are equally opaque and hard to comprehend with the human brain.  However, there is an allure in the power of these techniques but without easy comprehension I fear we are moving into an era of data distrust.

The Power of Data (Engineering)

The Custom Knowledge Leaps Data Wrench

The secret to successful analytics lies in data engineering, as much as algorithm selection. Sure, there are exceptions to this. No doubt there are times when only one specific algorithm will work for a particular set of data. However, we believe there is no substitute for sound data engineering.

Data engineering is the process of feature creation.  Features in the data are what an analytics algorithm will use to making predictions or estimation. Depending on how features are being created by a data engineering process will ultimately determine how human-readable the final models will be. It is easy to go from data engineering to data over-engineering.

An example of the pitfalls of data over-engineering is in the use of Support Vector Machines. The SVM classification algorithm is very powerful, it achieves this by a) only focusing on the handful of data points which defy a simple black-and-white separation of the data and b) performing data engineering that exposes powerful data features but which might not make sense to the ordinary person.  For some use cases this is acceptable, but SVM classifications could easily enter the territory of "snake oil".  SVM are an expert-user tool and the end user has to trust the person performing the analytics, because the outputs become too complex to explain in simple human terms.

Human readable models are a current focus of KL. We are in the middle of building out our data engineering functionality to allow users to create human-readable features from many different data-structure types. These new features will improve the power of KL's analytics algorithms without rendering them exclusively machine-readable.

When It Comes To Rules Based Classification, Less Is More

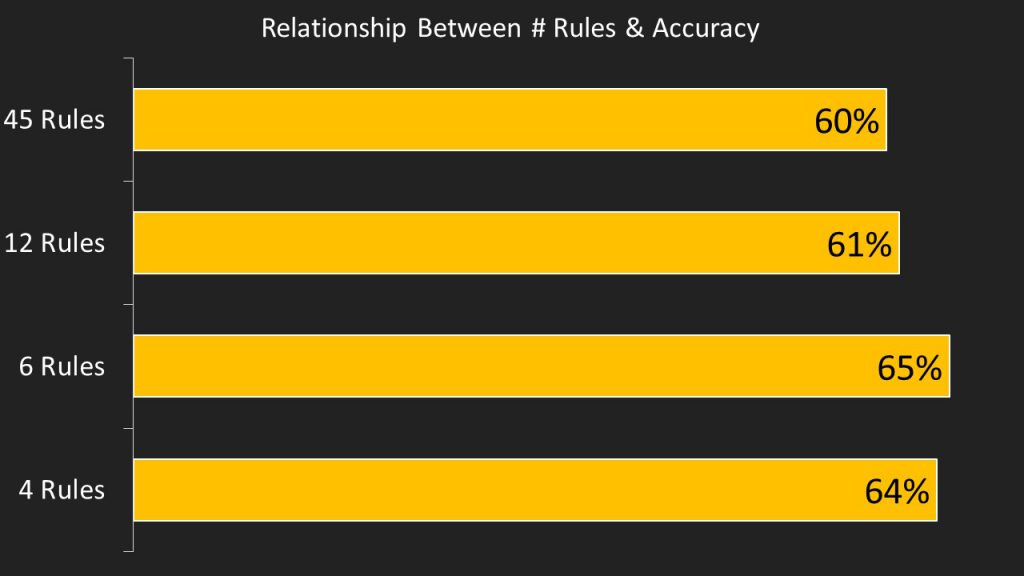
We have been running trials on a 16 question survey, predicting the responses to a particular question using other data in the survey. What we discovered is that the more rules we allowed KL analytics engine to produce, the lower the accuracy and the harder it becomes to explain the model to another person.

Predictive Accuracy of Knowledge Leaps Analytics Engine Using 10-Fold Validation - Best Guess Accuracy = 50.2%


Human Learning: A Necessary Output From Machine Learning

To test the functionality of the application we have been using some real life data either from people we know who work with data in various companies or from Kaggle (the data science community recently acquired by Google).

Our favorite test data set from Kaggle is the Titanic survivor data.   We like it because there are a small number of records in it (c. 900)  and it does not contain many variables (the notable ones are gender, age, point of embarkation, cabin number, cabin level and whether they survived or not).

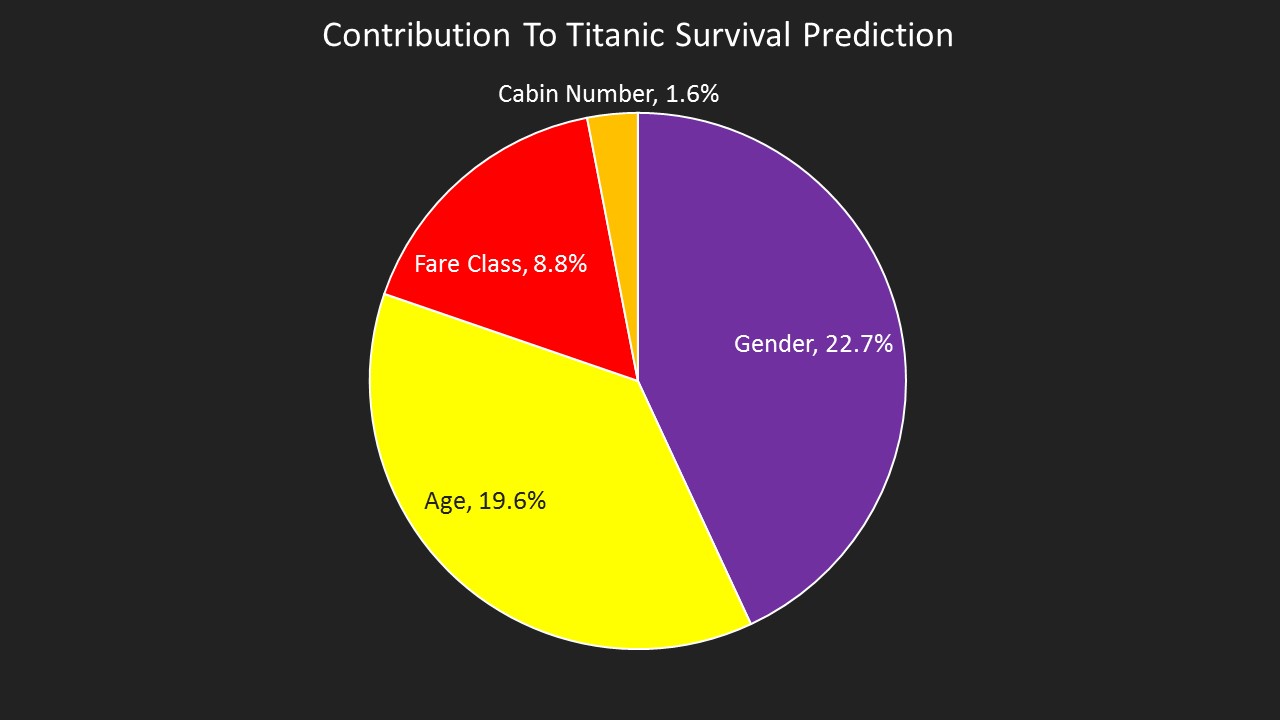
Kaggle runs competitions to see which data scientist can produce the most accurate prediction of survival.  While we are interested in accuracy (the model produced on KL  has an accuracy of 80% vs a guessing accuracy of 51% based on the incidence of survivors in the data we have), we are more interested in both accuracy and human readability of the model. This graph shows the outputs of the model drivers, this shows, for example, that a passenger's gender contributes 22.7% of our knowledge about whether they survived or not.

While accuracy is important, being able to relate the model to other people is just as important as it means that we humans can learn, not just machines.


Contribution of Factors On Survival Outcome of Titanic Passengers

Product Vision – Resolving An Analytics Contradiction

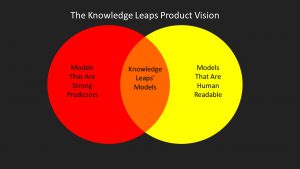
A recurring theme of this blog will be the differences between human  readable models vs highly predictive models, my vision for the product is to combine these two elements - producing accurate models that can be easily explained to non-technical people. Putting the human into analytics, if you will.  The challenge will be how to turn this into a reality without confusing the user.