If your job involves working with lots of different data files and you work in a team that uses these different data sets, finding the latest version can be a time suck. We have an answer for that with two new features we have launched this week.
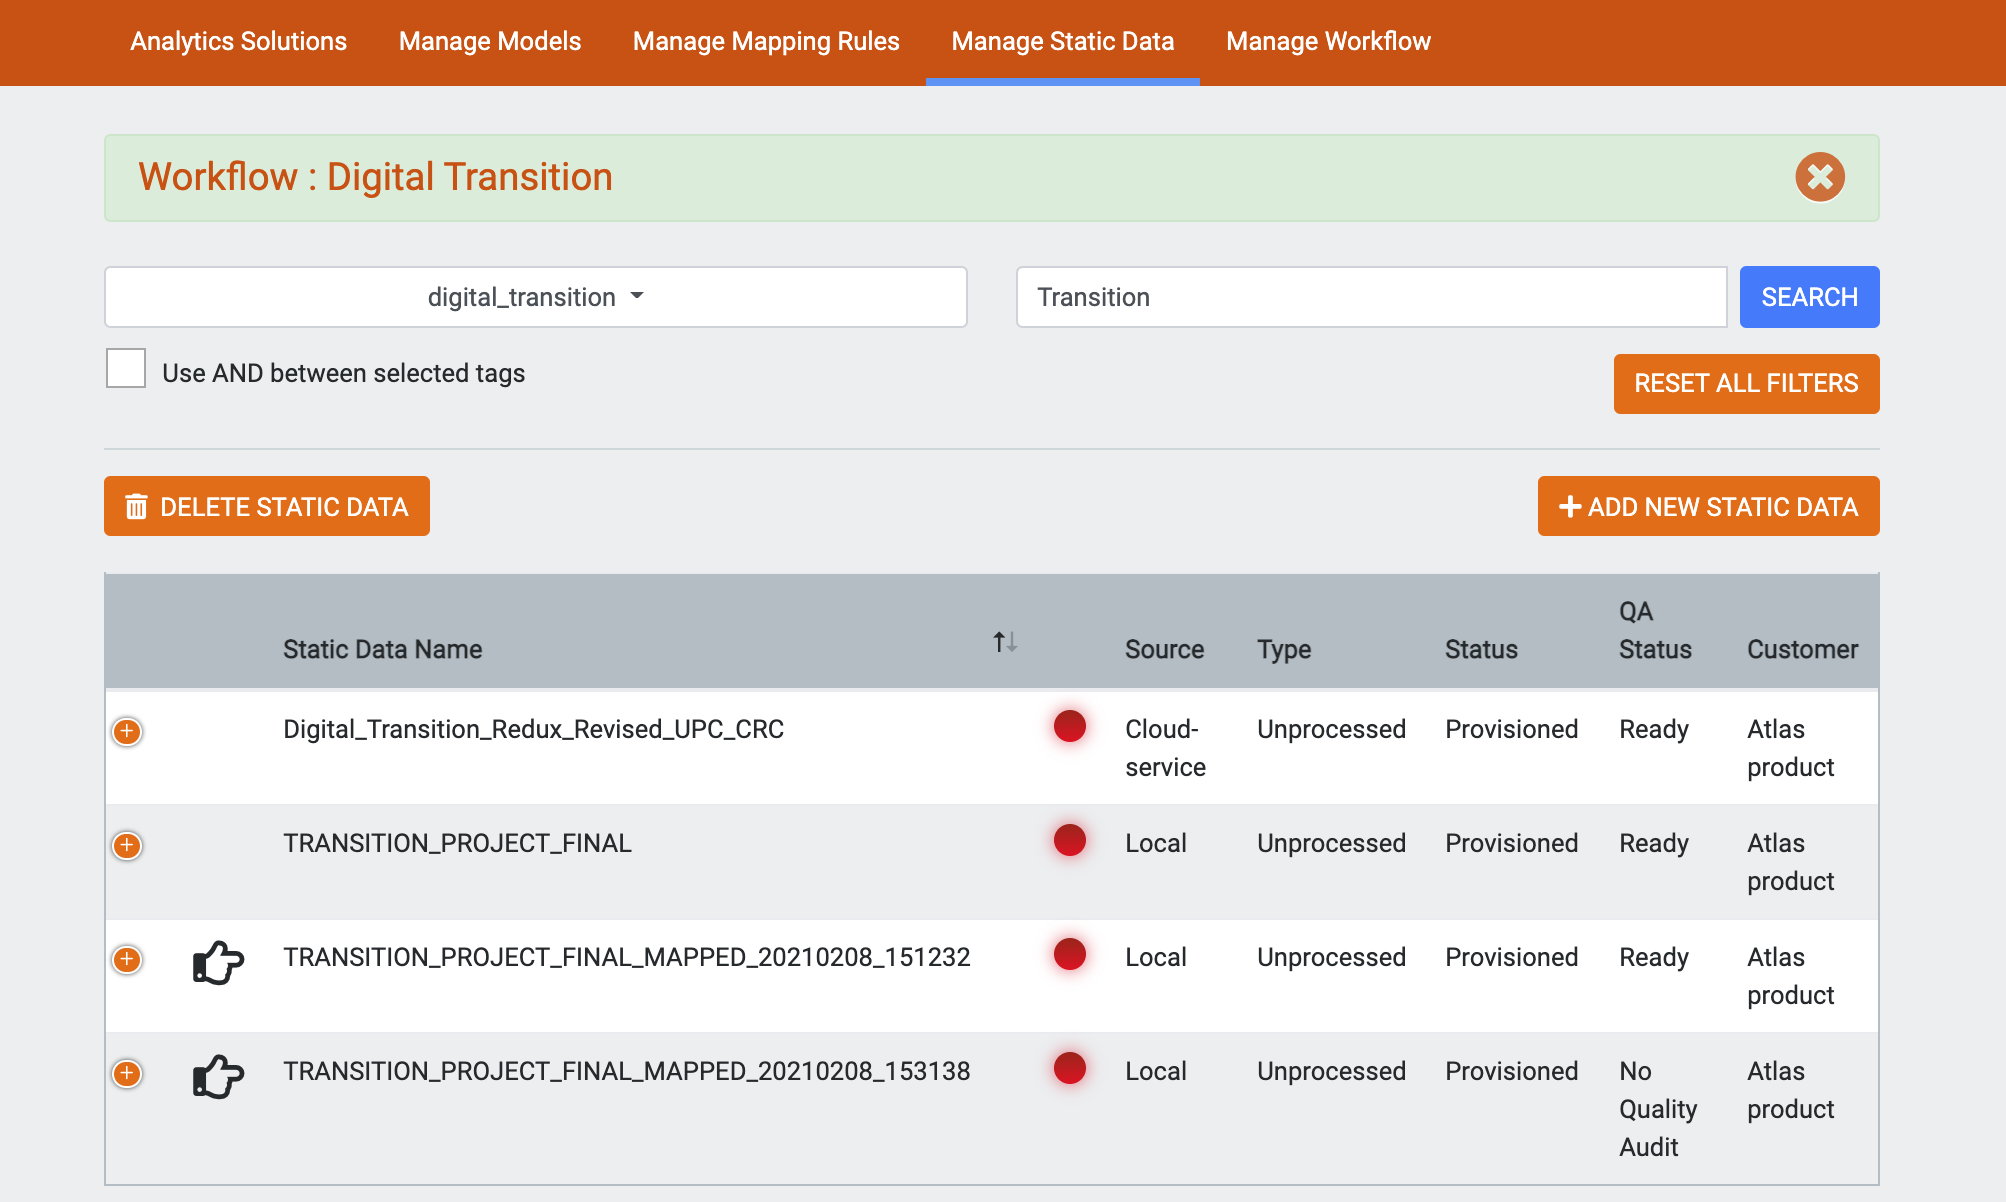
Workflows
The workflows feature lets you view only data sets,reports, charts and operation files that have specific tags assigned. Once a workflow is selected these tags persist through all views in the app.
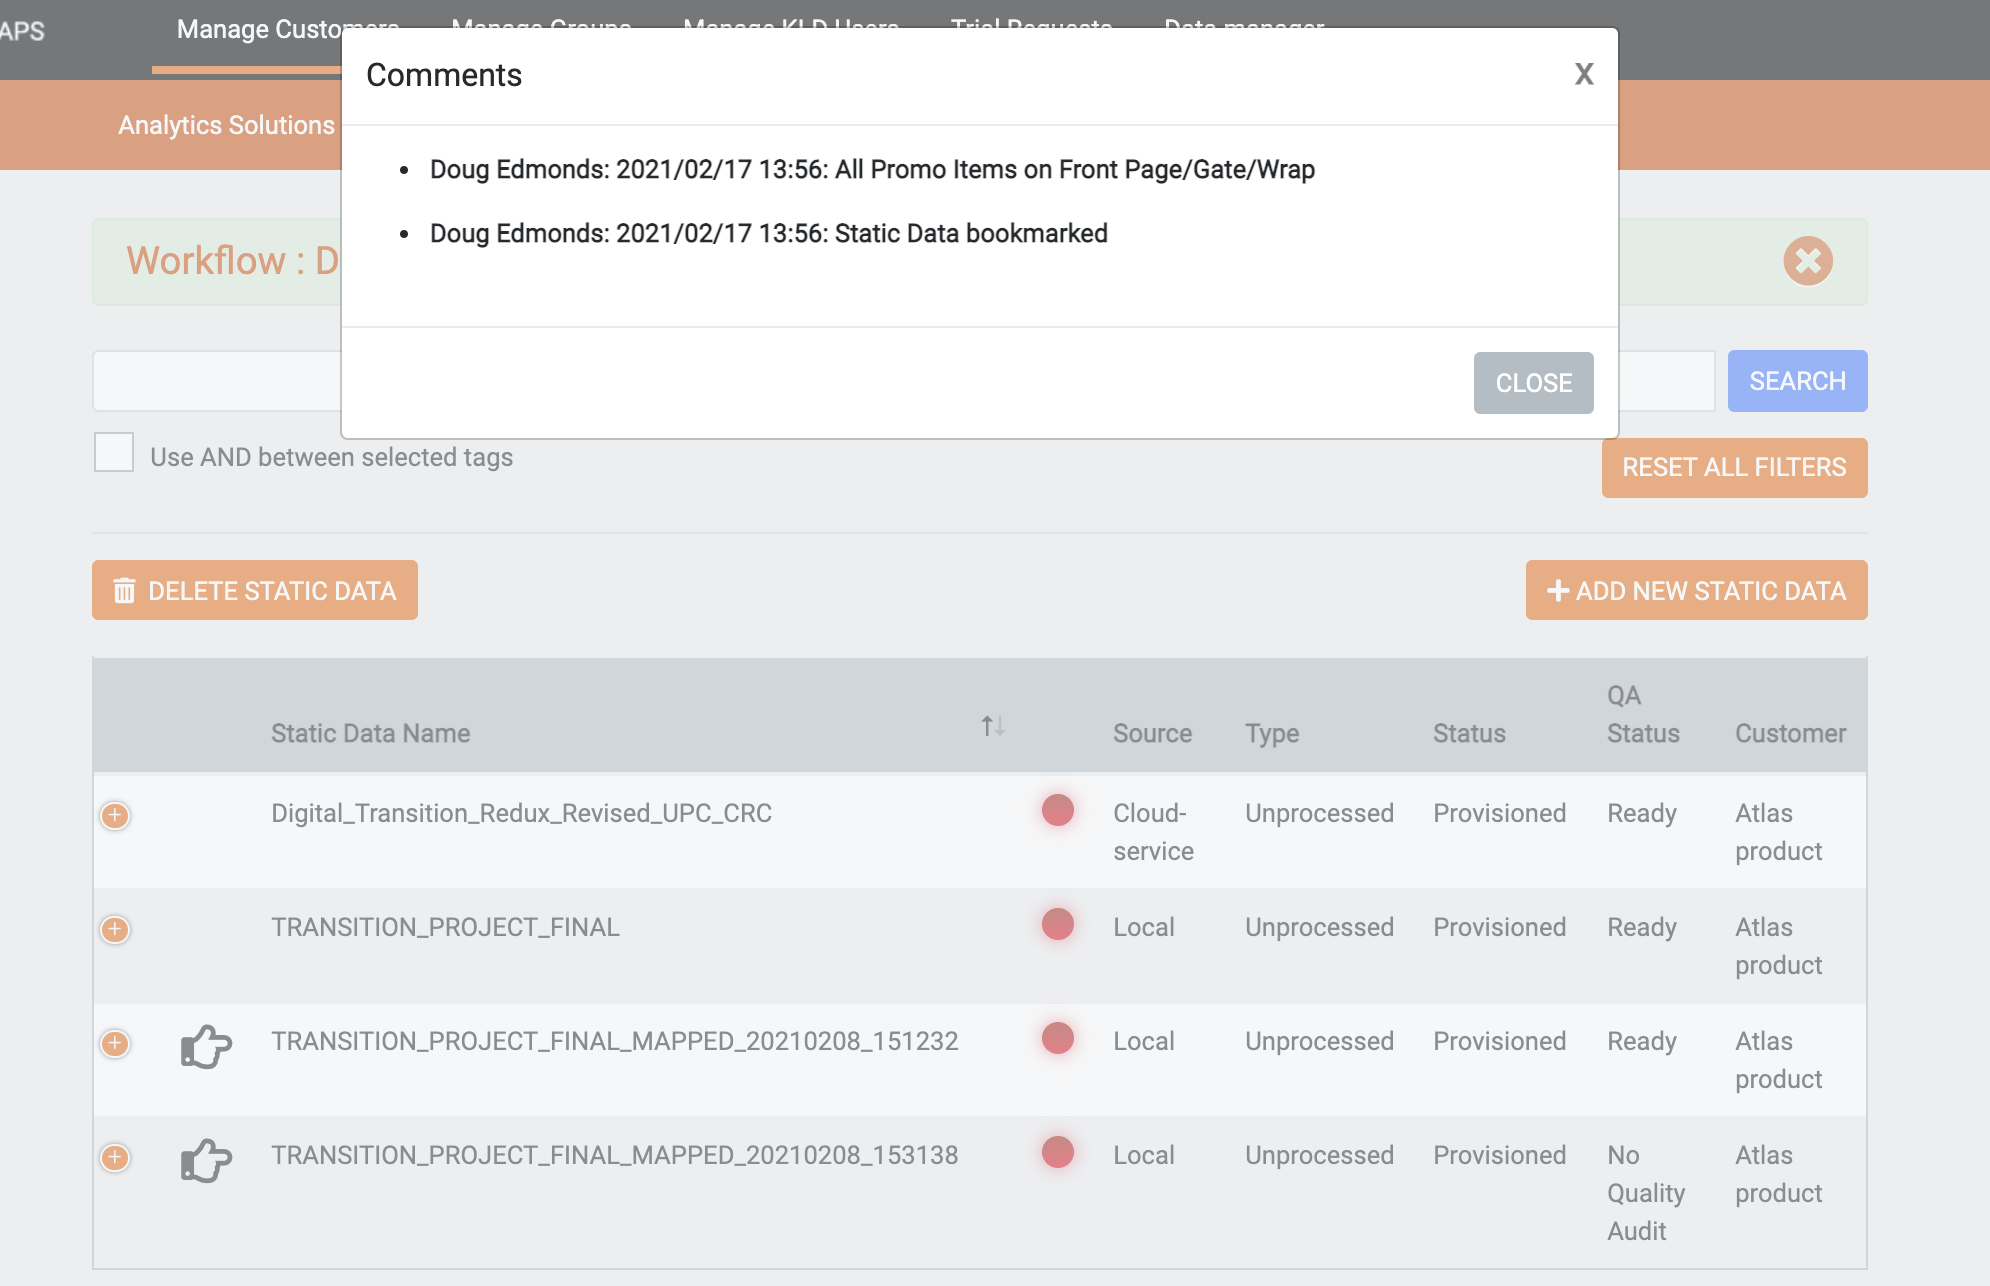
Bookmarks
This feature bookmarks a specific chart or dataset so that it can be easily found and distinguished from other files and charts in the view. When you have created the perfect chart, bookmark it!
Apply filters and mapping files to other filters and mapping files. This feature helps create randomized lists and sub filters based on new criteria. For example, extract a list of userIDs from a data file, apply gender from a look up table. Then filter this list by gender to create a specific list of users. This new file can then be sampled randomly to create a new list of random userIDs that meet a specific criteria.
Download file compression by default. When users download data to their local computers they are compressed by default.
Merge data now runs in background: some users were struggling trying to combine multi-GB data files. We now merge large data sets in the background to avoid memory issues.
Server-less charting: All charting has been pushed to server-less environment.
We launched a new feature today. The Knowledge Leaps platform allows users to specify hundreds of charts with a few clicks. For example a user can plot sales by date split by store ID using a simple flow. This can lead to 1000s of charts being produced, each one derived from millions of lines of data.
Occasionally we will send out an email newsletter containing some detailed and interesting case studies based on the data we have access to. Sign up below.
It doesn't take long to realize that data is agnostic to source. Web logs look similar to retail transaction data. Survey data and customer profile data can be handled in the same way.
When building a data platform, finding a niche is hard because if data is source-agnostic, so is the platform. The platform we have built is a generalist product; point it at any data source or stream and it will be useful. What links all the data sources together is another generic concept - customers.
Generalist products are hard to sell, primarily because it is hard to find audience insights that help contextualize the problems the product can solve.
For the past five years of building the product we have found it is easier to write code than create a succinct product proposition. In recent weeks, some ideas have been crystalizing and we landed on this:
Knowledge Leaps is a customer data platform for storage, engineering, and analytics of all types of customer data.
Knowledge Leaps is a cloud-based data management platform that allows for collaborative analytics, data management and data-workflow management.
Why Human Data Is More Powerful than Tools or Platforms.
At KL we realize the value of data is far greater than either analytic tools or platforms. As a team, we spend a lot of our time discussing the topics of data and analytics, especially analytics tools. We used to devote more time to this latter topic in terms of selection of existing tools and development of new ones. We spent less time talking about platforms and data. Overt time we have come to understand that all three of Data, Platform, Analytics are vital ingredients to what we do. This is visualized in our logo, we are about the triangulation of all three.
On this journey, I have come to realize that some things take a long time to learn. In my case , when you study engineering, you realize that the desire to make tools (in the broadest sense) is in your DNA. Not just your own, in everyone's.
Building tools is what humans do, whether it's a flint arrowhead, the first machine screw or a self-driving car. It's what we have been doing for millennia and what we will continue to do.
As a species I think we are blind to tools because they are so abundant and seemingly easy to produce - because as a species we make so many of them. In that sense they are not very interesting and those that are interesting are soon copied and made ubiquitous.
What is true of axes, arrowheads and pottery is also true of analytics businesses. The reason it is hard-to-build a tool-based business is that the competition is intense. As a species, this won't stop us trying.
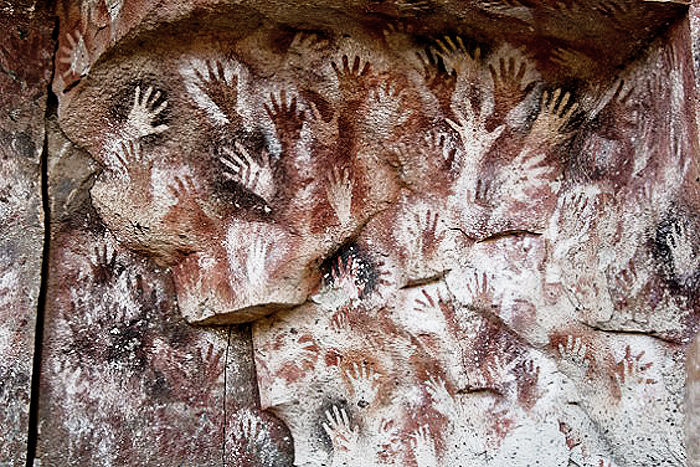
In stark contrast to analytics tools, is the importance of data and platforms. If a flint arrowhead is a tool then the cave painting is data. When I look at images of cave paintings, such as the cave of hands shown, I am in awe. A cave painting represents a data point of human history, the cave wall the platform that allows us to view it.
This is very relevant to building a data-driven business, those firms that have access to data and provide a platform to engage with it will always find more traction than those that build tools to work on top of platforms and data.
Human data points are hard to substitute and, as a result, are more interesting and have a greater commercial value than tools.